Aera Discovery™
Powerful analytics visualization with real-time data
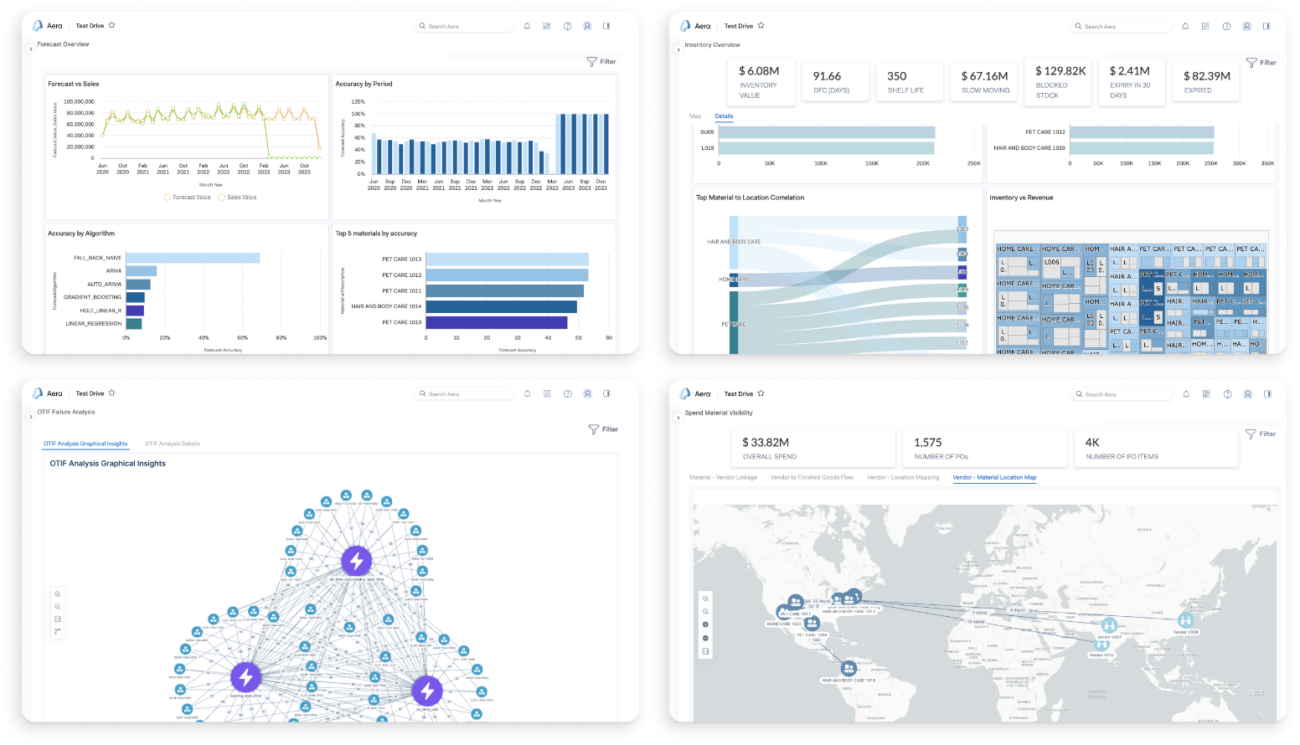
Within Aera Decision Cloud™, Aera Discovery provides analytical and visualization tools with real-time access to the Decision Data Model™ – a cross-functional, “beyond the four walls” data model for decision making that harmonizes data from across your ecosystem.
Discovery’s data and analytics visualizations show the context behind Aera’s recommendations. Designed for scale with on-the-fly compute and query optimization, Discovery delivers both high-level views and the ability to drill down into transaction-level details. Discovery helps you create and share custom visualizations built on live data, revealing the insights your business needs to drive better, faster decision making.
Benefits
- Easily create and share custom visualizations: Discovery’s drag-and-drop interface makes it easy to build visuals that support decision making – with live KPIs, charts, tables, and custom elements – then share them across your business to improve communication and collaboration.
- Designed for decision making at scale: Aera Discovery offers a query optimizer and on-the-fly compute to support digitized decision making across your enterprise.
- Blend your own data sets: Use drag-and-drop processes and filter definitions to blend data from separate parent systems, then build KPIs on top of these to create reports, charts, and pivot grids.
- Supports decision automation: Across the platform, Discovery enables your teams to leverage analytics on a journey to digitize, augment, and automate decision making. For example, drilling down into a recommendation in Decision Workbench reveals embedded analytics and a visualization of the context behind that decision.
Features
- Visualizations – Choose from different types of customizable visualizations, with both out-of-the-box and user-created customizable options for illustrating data and trends with charts, KPIs and metrics, tables, and more.
- Analysis Map – Gain a deeper understanding of data or trends via root cause analysis and the ability to drill down from summary metrics.
- Monitors – Notify users when specific conditions are met, or via regularly-scheduled alerts.
- Collaboration – Share reports and dashboards among users and teams, enabling them to share insights and communicate more effectively.